NCAA Tournament Model
A classification model, four days, and a lot of web scraping try to produce a passable bracket.
This project attempts to create a statistical model to predict the outcomes of the 2016 NCAA Men’s Basketball Tournament. To make this project more difficult, I started it only four days before the start of the tournament. And to up the difficulty even more, this four day period also included procuring and cleaning the data for building and running the model.
Data Source
As I said before, I started this project without a definitive data source. I initially planned to use the dataset from Kaggle, which used contained extensive game and tournament data for the past 30 seasons. Kaggle did fail to mention, however, that the past 30 seasons does not contain the current 2015-2016 season. This exclusion was a deal-breaker for me as I needed to predict the upcoming NCAA tournament, not past tournaments. After scouring Google for a free data source, I realized that my next best option was to get game data from sports-reference’s college basketball section.
To scrape this data, I reused a web scraping script in R (code). In conjunction with the R script, I also used a python script that handled most of the data manipulation (code).
After I fetched the raw data in R, I switched to a python script to format, filter, and process the data. This was an iterative process because I had to scrape multiple sections of the website:
- Scrape the names of all the college basketball teams in 2016
- Process the names in Python to convert the team names into URLs
- For each team, scrape its 2016 schedule
- Process the schedule in Python to produce the URL to each game
- For each game in each team’s schedule, scrape the game statistics
By the time I finished, I had scraped over 10,000 games (some were duplicates), which meant I had sent thousands of requests to sports-reference’s website. Luckily, it all worked without any problems.
Data Exploration and Variable Selection
In an ideal world, I would’ve considered a wide range of variables and time frames to use for my model. Unfortunately, I was limited to the data I quickly scraped above. I had the following variables for each team and each game:
- Shooting: eFG%
- Turnovers: TOV%
- Rebounding: ORB%
- Free Throws: FTFGA
- Pace
The first four variables are the same Four Factors I used in my NBA model, but I felt that the college game has some important differences.
First, the college game has many more teams. The difference is so vast that there are more college conferences than NBA team: the NBA has 30 teams, while Division I college basketball has 32 conferences and 351 total teams. In the NBA, each team plays every single other team at least once. In college basketball, teams will play a majority of their games within their conference, playing a very small number of out of conference teams.
Second, the greater number of conferences, teams, and players leads to a much larger variance in talent. Combined with the non-dispersive schedules mentioned above, team’s schedules can vary in toughness.
To account for these differences, I also pulled an end of season SOS metric for each team from sports-reference.
For each game in the season, I calculated each team’s average Four Factors and Pace of past games in the season. Usually, I would’ve experimented by varying the number of past games to include, but since there are so few games in a season, I wanted to keep as much training data as possible.
Model Type
I leveraged code from my NBA modeling project, so I used the same two classification models: a Support Vector Machine (SVM) model and a Random Forest model.
For each team in the tournament, I created a separate model. The process looked like this:
- Get training data of regular season games, which contained opponent’s metrics mentioned above and had a Win/Loss indicator as the outcome
- Feed training data to both types of models (SVM and Random Forest)
- Using cross validation, determine which model performs better
- Store best performing model for each team
Simulation Method
To simulate the NCAA tournament, I imported the teams and their respective seedings. Then for each matchup, I scored each team’s model and extracted the win probability from each team’s model. I averaged the probabilities from both models in each matchup to come up with my outcome probabilities. Using a random number generator mimicing this probability distribution, my simulation determined which team would advance.
Then with these win probability outcomes, I ran a Monte Carlo simulation of the tournament 100 times, tallying up which teams appeared most often in each round of the tournament. Using that tallied up view, I filled out a bracket, keeping as true to the model as possible.
Keeping true to the model proved difficult sometimes due to Simpson’s paradox.

In the case of the bracket, sometimes a team was the most likely team to be in a particular round, even though that wasn’t the case for a previous round. This phenomenon is caused by differing win probabilites at each round for this team. The team has a lower win probability in the previous round, yet has a higher win probability in the later round. When these situations arose, I used my best judgment to determine which scenario was more likely.
Results
Not so good.
In ESPN’s Tournament Challenge, the bracket captured 500 points, putting the entry in the 15th percentile. The model did get 3/8 for the Elite Eight, but failed pretty spectacularly in the next round. Here’s the round by round breakdown:
| Round of 64 | 240/320 | |
| Round of 32 | 140/320 | |
| Sweet 16 | 120/320 | |
| Elite Eight | 0/320 | |
| Final Four | 0/320 | |
| Championship | 0/320 |
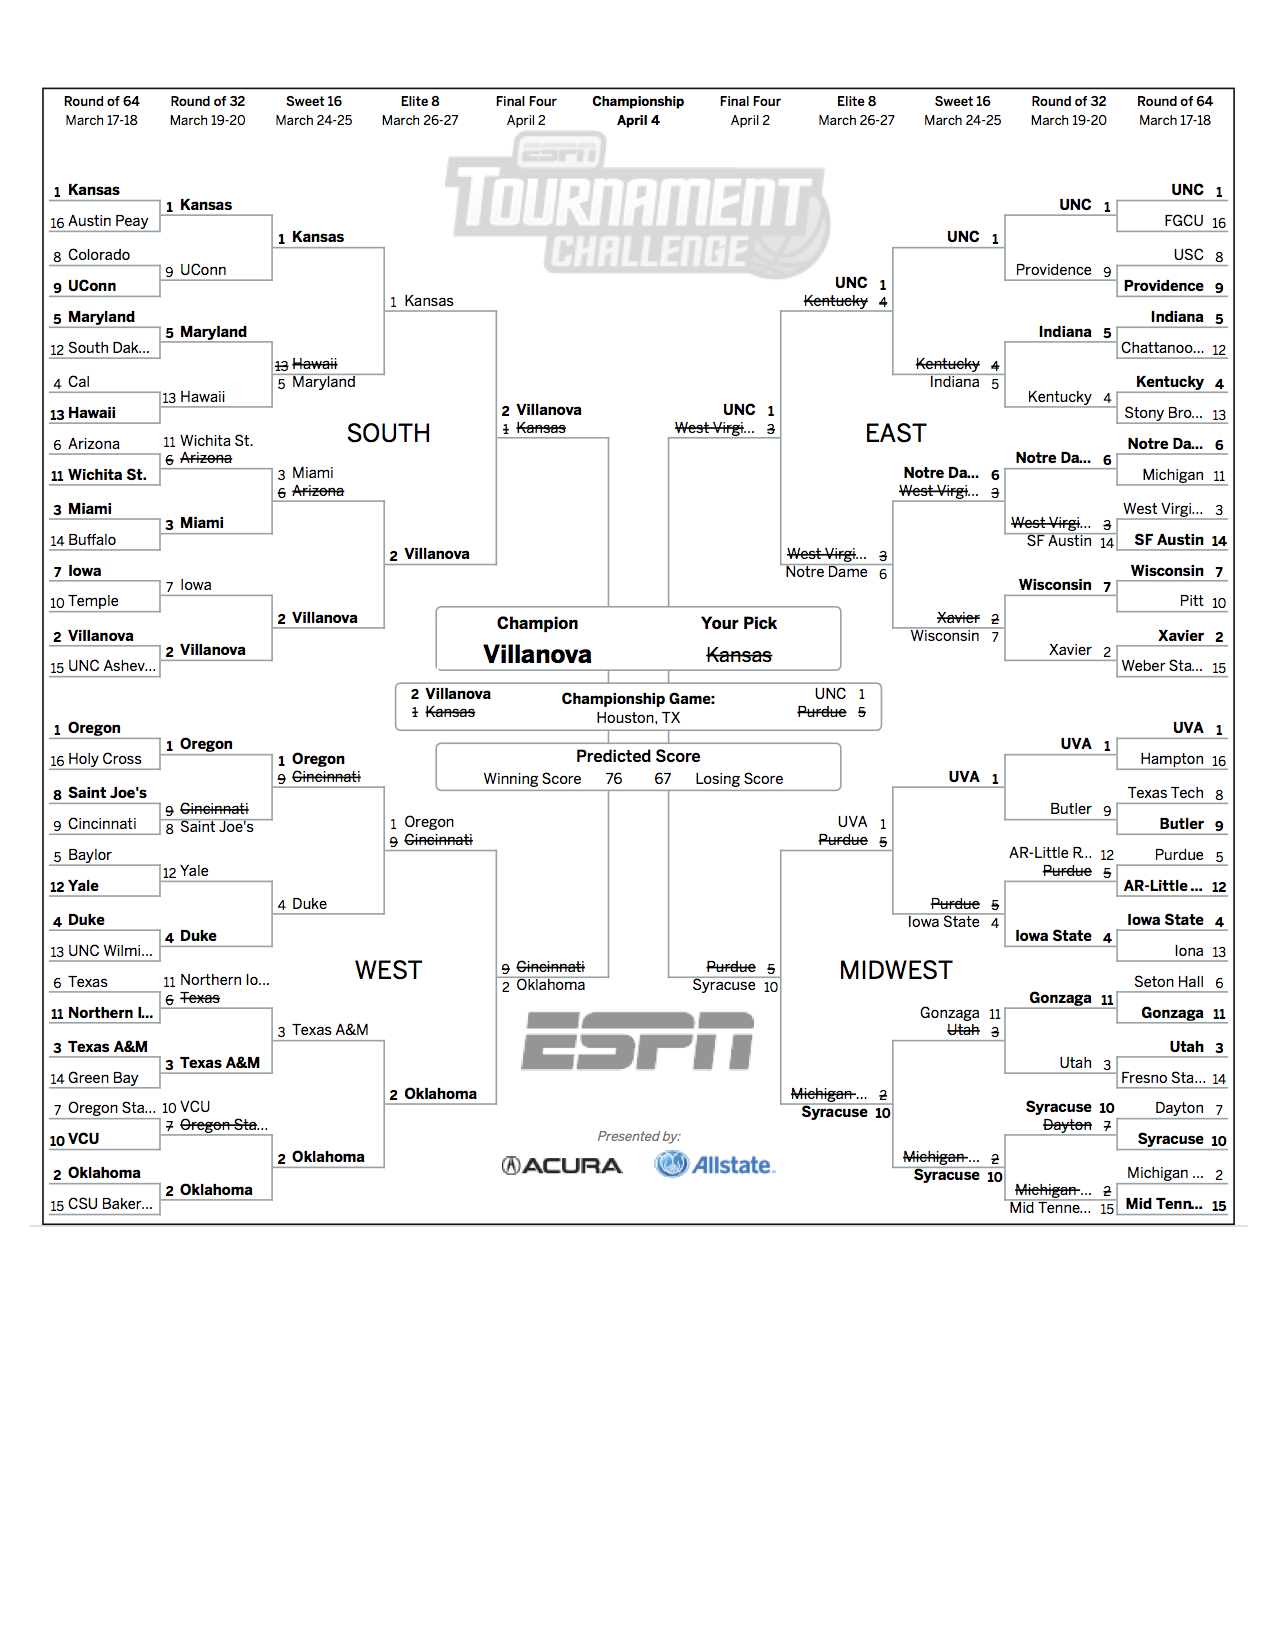
Here’s the full bracket:
Improvements
Since I had such a short time frame to build the model and submit my predictions, I have a large list of items that I would’ve liked to do:
- Use past seasons and tournaments to truly cross validate my models and simulations
- After simulating the tournament, pick the outcome that generates the most amount of points according to a standard scoring system
- Use regression models instead of classification models because some teams rarely lose in a given season, leading to sparse outcomes
- Experiment with different time frames for the training dataset, such as using past seasons
- Instead of making a model for each team, make a model for a group of similar teams