NBA Season Ticket Optimization
See how I how researched and optimized my Washington Wizards partial season ticket plan to maximize expected revenue using a MILP optimizer.
Overview
The professional sports ticket market is like any other market. There are sellers, buyers, and traders. As a result, there is often an arbitrage, allowing an individual to make a profit. In this post, I’ll describe how I bought a Washington Wizards partial season ticket plan to maximize profit.
The marketplace
First, it’s helpful to know the context of the marketplace for professional sports tickets, specifically for the NBA. To explain the nuances, I’ll go through the commodity (which is the ticket itself), the sellers, and the buyers.
In this marketplace, the commodity is a ticket to a sports game. Based on my experience in buying NBA tickets, I assumed that these two factors determined the demand for tickets: location, and popularity:
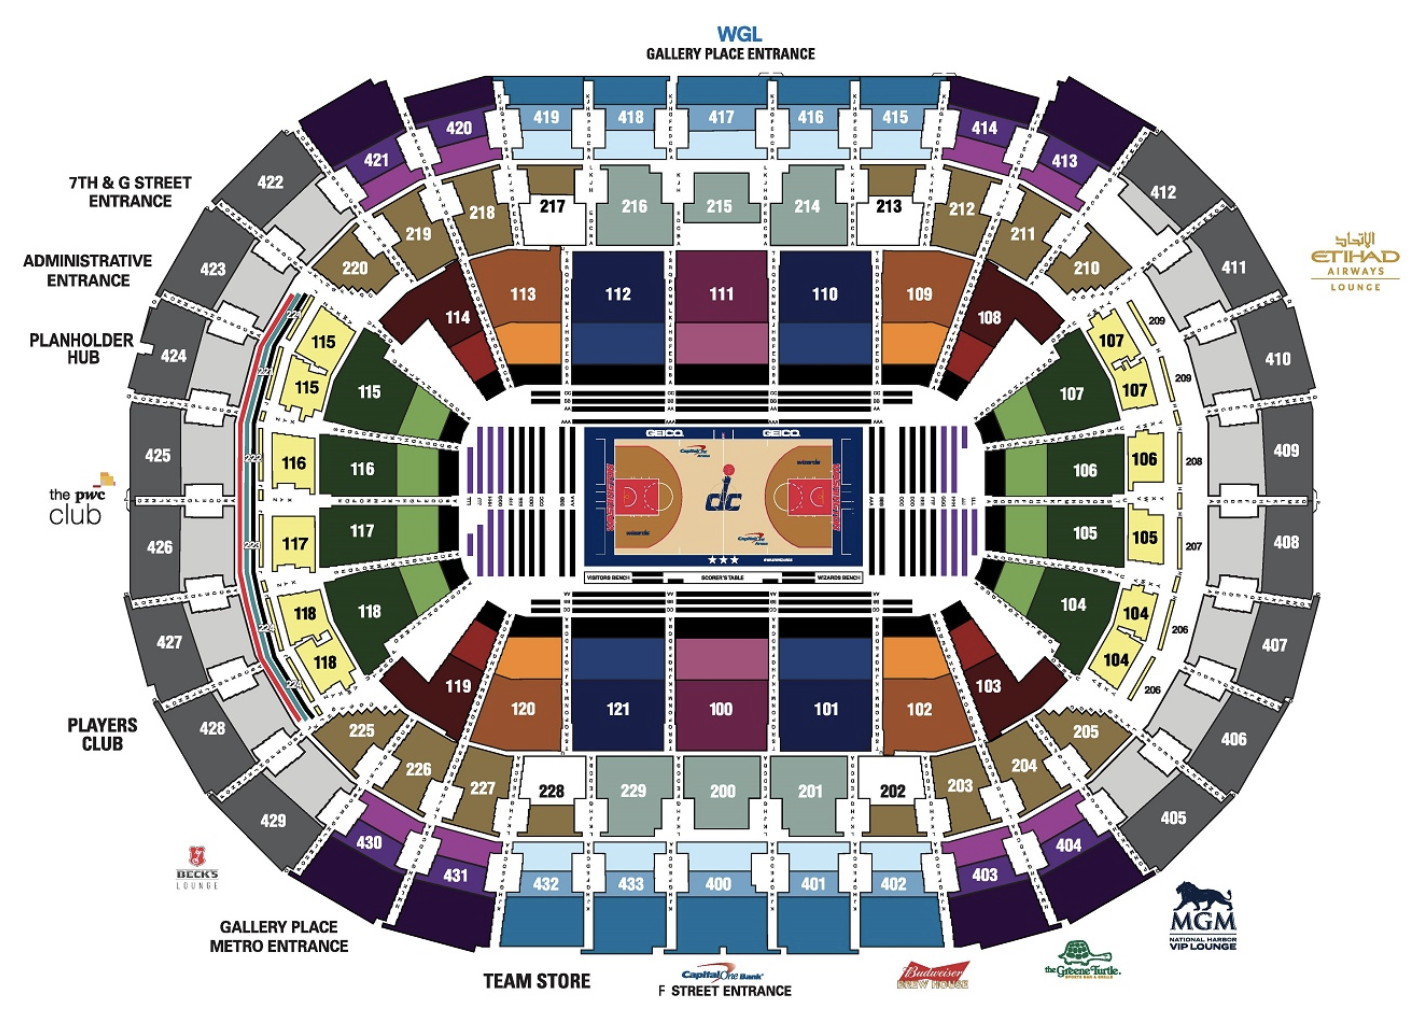
- Location: For basketball games, there are two dimensions of the location: the distance to the court and the viewing angle of the court (e.g. behind the basket or on the sidelines). Typically, the most desirable location is close to the court and on the sidelines.
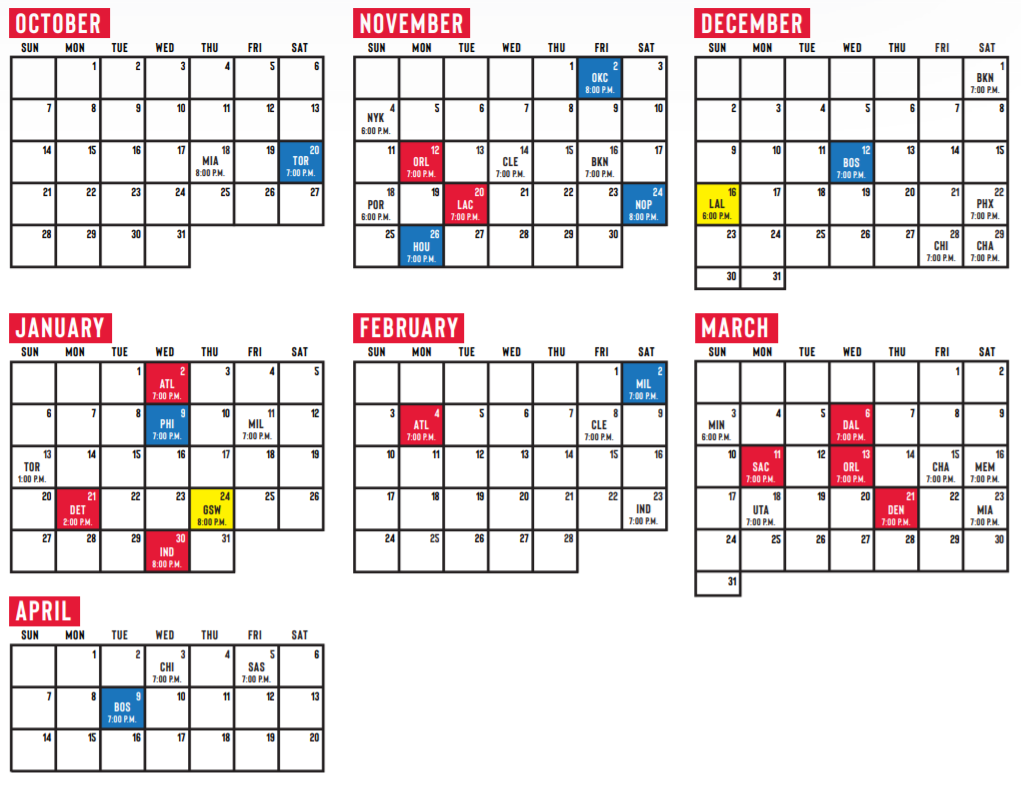
- Popularity: The popularity of a particular game is driven by the matchup and the time of the game. In general, you’d expect the most popular games are when the opposing team is popular in your area and when the game is on a weekend, making it more accessible to the general public
In this scenario, the seller is the NBA. They sell the tickets to the general public in a variety of packages, ranging from individual game tickets to season ticket plans. Typically, they’ll offer both better seats and better prices to larger packages, enticing people to buy larger ticket plans. For packages that allow customers to select individual games, the NBA will differentially price games based on the factors described above: location and popularity.
To demonstrate this, here’s how the NBA prices Wizard tickets for location (where each color is a different price):
And for popularity (where each color is a different price tier):
Finally, the buyers are the people who buy these tickets, either directly from the NBA or from a reseller, and attend the game. It’s important to note that when a buyer uses a platform, such as Ticketmaster or StubHub, they also pay a processing fee to that platform, cutting into the potential profit of the sellers.
The opportunity
Given this marketplace, there’s an opportunity to buy particular tickets from the NBA and resell them at a higher price. If I can identify games that are priced lower than what buyer will pay, even after all processing fees, I can make a profit. Looking at the different packages from the NBA, the partial season ticket plans looked like my best bet. Compared to buying individual game tickets, these plans offered lower per-game prices and better seat locations. Compared to buying complete season tickets, these plans had higher per-game prices, but allowed me to choose which games I wanted, giving me the ability to identify and choose which games to buy and resell.
For the partial season ticket plans, here’s a short description of what each one offered:
- 6 game plan, where you can choose each game with few restrictions
- 13 game plan, where you can choose each game with few restrictions
- 13 game plan, where they choose all 13 games for you
In addition, there are a couple more nuances to these plans. In the plans where you choose your games, each game’s price is determined by its location and pricing tier (as described in the section above). For the 6 game plan, you can only have one game in the top tier (i.e. gold). Most importantly, each plan comes with a free bonus game. This bonus game is limited to a red tier game for the 6 game plan and to either a red or white for the 13 game plans.
All in all, the selection of games sets up a nice optimization problem.
Optimization problem
The selection of your tickets is a problem that can be solved with mixed integer linear programming (MILP). We can neatly summarize the problem in mathematical terms:
- Objective function: Maximize profit: x1profit1 + … + xnprofitn
- Constraints:
- Number of games = 7 or 14: x1 + … + xn = 7 or 14
- Number of gold games <= 1 for 6 game plans: x1gold1 + … + xngoldn <=1
- Bonus game must be of a certain type: x1red1 + … + xnredn >=1 (for 6 game) x1red_or_white1 + … + xnred_or_white_n >=1 (for 6 game) where xi is either 0 (don’t buy) or 1 (buy) for each home game (of which there are 40*)
- There are usually 41 home games, but one game is being played in London this year
To solve the problem above, you need some sort of algorithm to help you find the best choice. If you were to evaluate every single possibility, it would take a decent amount of processing power and time. For example, if we had to choose 13 games out of 40, here’s how many combinations are possible:
40C13 = 12,033,222,880
There isn’t an obvious way to cut down these possibilities to a more manageable size, so it’s nearly impossible to iterate through every combination. This is where an algorithm comes into play. Several python packages exist that implement algorithms to solve these MILP problems almost instantaneously. For my project, I used Google’s OR-Tools package.
Setting up the data
To solve this optimization problem, I first had to obtain cost and revenue data for each game.
Cost data was easy–that came from the NBA pricing structure described above. To simplify the optimization problem, I only considered one seating section, the center sideline upper section.
For revenue data, I had to be more creative. Ideally, I could predict the exact amount each ticket would sell for. In the absence of historical data to build a model, I decided to base my estimates off of the current tickets being offered on Ticketmaster. In the seating section I chose above, I found the minimum price the tickets were being offered for each game. I thought this would give me a decent estimate of what I could expect to sell my tickets at. Finally, I took a 10% haircut off those prices to account for reselling fees.
Solving this in python
Now that I had the necessary data, I set out to solve this optimization problem in python. I leveraged the OR-Tools package from Google, which offers a MILP optimizer. After installing the necessary python packages, I set up a MILP solver object with the below code:
solver = pywraplp.Solver('SolveIntegerProblem', pywraplp.Solver.CBC_MIXED_INTEGER_PROGRAMMING)
I then made the xi variables by creating n integer variables:
for i in range(len(game_list)):
        x_list[i] = solver.IntVar(0.0, 1.0, 'x'+str(i))
I then used the solver.Constraint class to create constraints for all the cases I described above.
Next, I enter the objective function, which was to maximize profit:
obj = solver.Objective()
    for i in range(len(game_list)):
        obj.SetCoefficient(x_list[i], int(game_list.loc[i, 'Profit']))
    obj.SetMaximization()
I then asked the optimization object to solve the problem and received solution values for each xi variable. A 0 meant not to buy that particular game, while a 1 meant to buy that game.
Results
After running this optimization problem for the 3 plans described above, I found the 6 game plan to be most attractive:
| Plan | Profit | ROI | ||
| Custom 6 Games | $193 | 41% | ||
| Custom 13 Games | $160 | 18% | ||
| Preselected 13 Games | $261 | 40% |
I followed the recommendation from the optimizer and ended up buying the 6 game plan, expecting to make a 40% return on my investment.
At the end of the season, I calculated the actual profit and felt a little underwhelmed:
| Game | Price Paid | Expected Selling Price | Actual Selling Price | Difference | Profit | |||||
| Clippers | $0 | $80 | $40 | -50% | $40 | |||||
| Rockets | $70 | $200 | $40 | -80% | -$30 | |||||
| Celtics | $140 | $220 | N/A | N/A | $0 | |||||
| Lakers | $336 | $460 | N/A | N/A | $0 | |||||
| Bucks | $100 | $120 | N/A | N/A | $0 | |||||
| Raptors | $100 | $120 | $86 | -28% | -$14 | |||||
| Spurs | $100 | $90 | $57 | -37% | -$43 |
Excluding games I went to myself, I spent $270, losing $87 or 32%. Though it’s not a completely fair comparison with my prediction (due to the games I went to myself), this is still a far cry away from a profit of %40.
Takeaways
In the end, all the models and algorithms could not overcome a huge factor to ticket prices, popularity. Between me purchasing the ticket plan and reselling the tickets, a number of events occurred that negatively affected the popularity of the Wizards games this season:
- Recurring injuries to Dwight Howard
- Season ending injury to John Wall in December
- Rebuilding efforts which resulted in trading away talented players, such as Otto Porter Jr. and Markieff Morris
As the team’s goals shifted from competing in the playoffs to rebuilding for next season (or even the season beyond that), ticket prices dropped and never matched the prices I saw on Ticketmaster before the season started.
These external factors make it hard to assess the successfulness of this ticket buying approach. Optimistically, it is possible that this approach helped me minimize losses, but it’s hard to tell without accurate ticket selling data for the games I did not choose. In the future, I would expect this uncertainty and variability to continue to play large roles in ticket prices. After all, many fields fail at predicting consumer preferences, so it’s not a huge surprise that this approach did not succeed in doing so either.